All posts tagged: visualization

How I invested 8760 hours in 2017

Inspired by Kunal Gupta’s How I Invested 2504 Hours post, I decided to perform my own audit for 2017. My goal was to compare how I actually invested my time to the ideal 24 hours I imagined back in 2016. This way, I could decide if I wanted to change my time allocation for 2018 and implement habits to help me do so. Back in 2016, here’s what I outlined for a typical day: Sleep and restorative (sleep and naps) – 7 hrs / 30% Creative and productive (content creation, workshops, culture) – 7 hrs / 30% Eating and social (meals, coffee, drinks) – 5 hrs / 20% Active and physical (exercise, walking, sex) – 3 hrs / 12% Quiet and reflective (meditation, reading, bath) – 2 hrs / 8%  The results. All in, I was able to account for about 80% of my time in 2017. Of that time, a third was scheduled, a third was unscheduled estimates and a third was sleep. While the math is obvious, it was still surprising to internalise that spending …

Honeycomb hexayurt

The first time I went to Burning Man, my experience was made much more comfortable by fellow campers who had prepared temporary shelters and offered me a spare. Insulation from cold, reflection of sun, firm walls, and being able to stand up removed many of the common irritations of camping. When our group began planning for this year’s trip to the Burn, I wanted to give them the same level of comfort. I set out to design a structure that would provide all of those benefits and some privacy, while minimising the amount of construction materials we’d have to buy and transport.The design I arrived at is based on the 6′ hexayurt, one of the many designs by Vinay Gupta. In order to reduce the amount of building materials required, I arranged them in a honeycomb layout. This saved us 4 sheets of 4’x8′ insulating foam and about a roll of filament tape. It could easily be expanded to incorporate more hexayurts, seemingly indefinitely (though it does make sealing much more difficult). Here’s the recipe.Preparation materials: …

The Reliants Project: 12 months

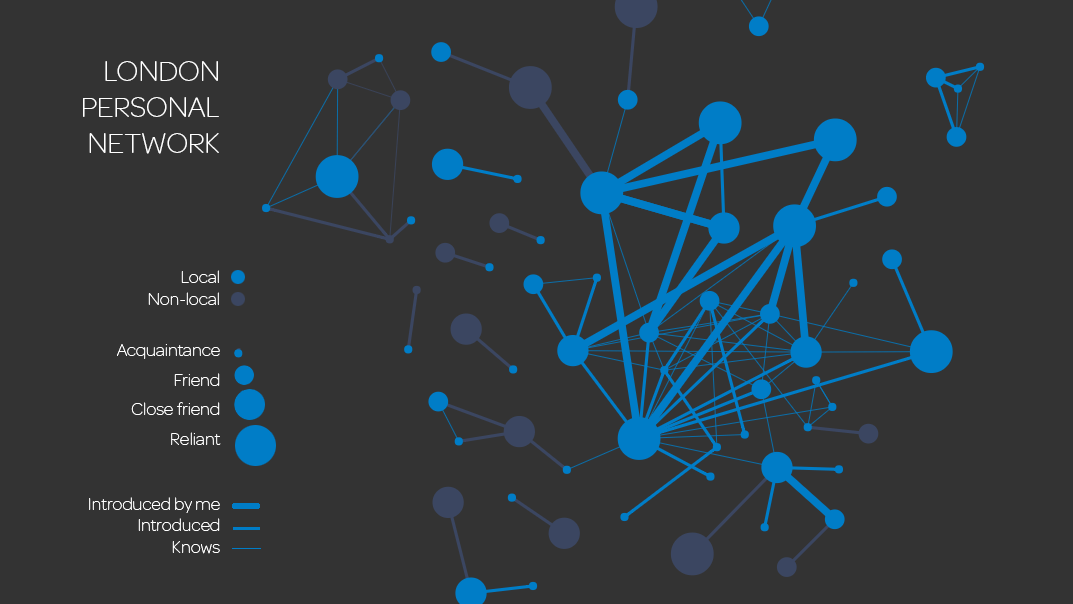
Can hardly believe it has been over a year since I moved to London! As an anniversary present, London gifted me my first truly serendipitous connection since my arrival. Until then, every new connection was the result of either a direct introduction or meeting at an event that both people intentionally attended. It’s a rare treat to meet anyone during those in between states; by accident, in public places, on transit. I treasure those moments because they often expose a ‘small world’ coincidence or a completely new, fascinating world.Additionally, I had the chance to participate in Wait But Why’s inaugural Wait But Hi event in August. Our group was even featured in their report (scroll down about 1/5th to “Some people went to restaurants…”). They asked their readers to fill out a (long) survey and then matched them in groups based on their interests and preferences. Some people were set up on individual blind dates while others participated in large group educational seminars (and many variations between). What a fascinating experiment in friendship, relationship and community building!Round up. Here are some of the more …

Graphics tell stories

Way back when, I explained in general how I use visualisations for personal storytelling. Finally, I have a specific test case that I can share. At the end of August, a very trusting friend agreed to join me for a 95km trail run along Hadrian’s Wall path. It’s considered the best-preserved frontier of the Roman Empire and covers a beautiful stretch of land from coast to coast in North England, just south of the Scottish border. In case you’re curious, we used Contours to organise the trip and they happily took care of booking rooms, recommending daily distances and luggage transfer. I’d highly recommend them! Here’s what I did before, during and after the experience along with the resulting visual.Before: What information do you think you want to capture? What are the best / most convenient tools to capture that data?In this case, I could easily collect the quantitative data I was interested in using Strava. This app can capture distance, time, pace, elevation change among other useful metrics. As an added bonus, it will …

Starting from scratch

It’s not every day that you have the chance to begin with a clean slate and choose every aspect and detail of your daily life anew. Of course, the opportunity rarely comes without it’s own set of constraints (perhaps geographic, financial or otherwise), but constraints are exactly what designers thrive on. As you may have guessed, that is exactly the situation I have found myself in, hence the recent radio silence. Luckily it has provided ample opportunities for applying design to life, which I hope to share over a series of posts.Location location location. For me, the most important decision is where to live. Few decisions have more impact on daily life and require a clearer set of priorities. For me it boils down to the following criteria: convenience (access to public transport, green space, shops, ≤ 30 min commute), neighbourhood (safe, diverse and vibrant street-level culture), space (“good bones” and efficient layout, outdoor space a plus), community (close to groups with whom I want to be active, such as friends, fitness programmes, makers, startups) and cost (≤30% of salary is a common reference). There were a number …